Projecting a Function on the
Vector Space V3 using the Haar Wavelets
This example is very similar to the first example, which projected a function onto a Fourier Space. We use the same function but a different interval. Once again, all the Maple code for this example is not present.
We start with the following function and graph.
![]()
Next, we define the inner product.
Now, we use the ODT to define our new function f.
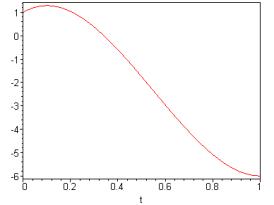
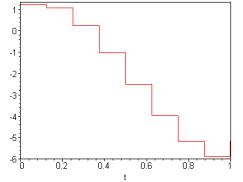
Next, we can graph the function f on the interval [0,1].
> plot(f(t), t=0..1, axes=boxed);
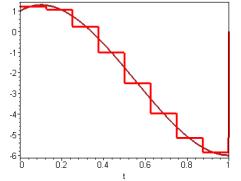
Comparing
h(t) to the projection of h(t) onto V3 is shown below.
> plot({f(t),h(t)}, t=0..1, axes=boxed, color=[red, brown], thickness=3);