Reducing effects of dispersal on the bias of 2-sample mark-recapture estimators of stream fish abundance
James N. McNair1, Carl R. Ruetz III1, Ariana Carlson2, and Jiyeon Suh3
1Annis Water Resources Institute, 2Department of Statistics, 3Department of Mathematics, Grand Valley State University
Overview
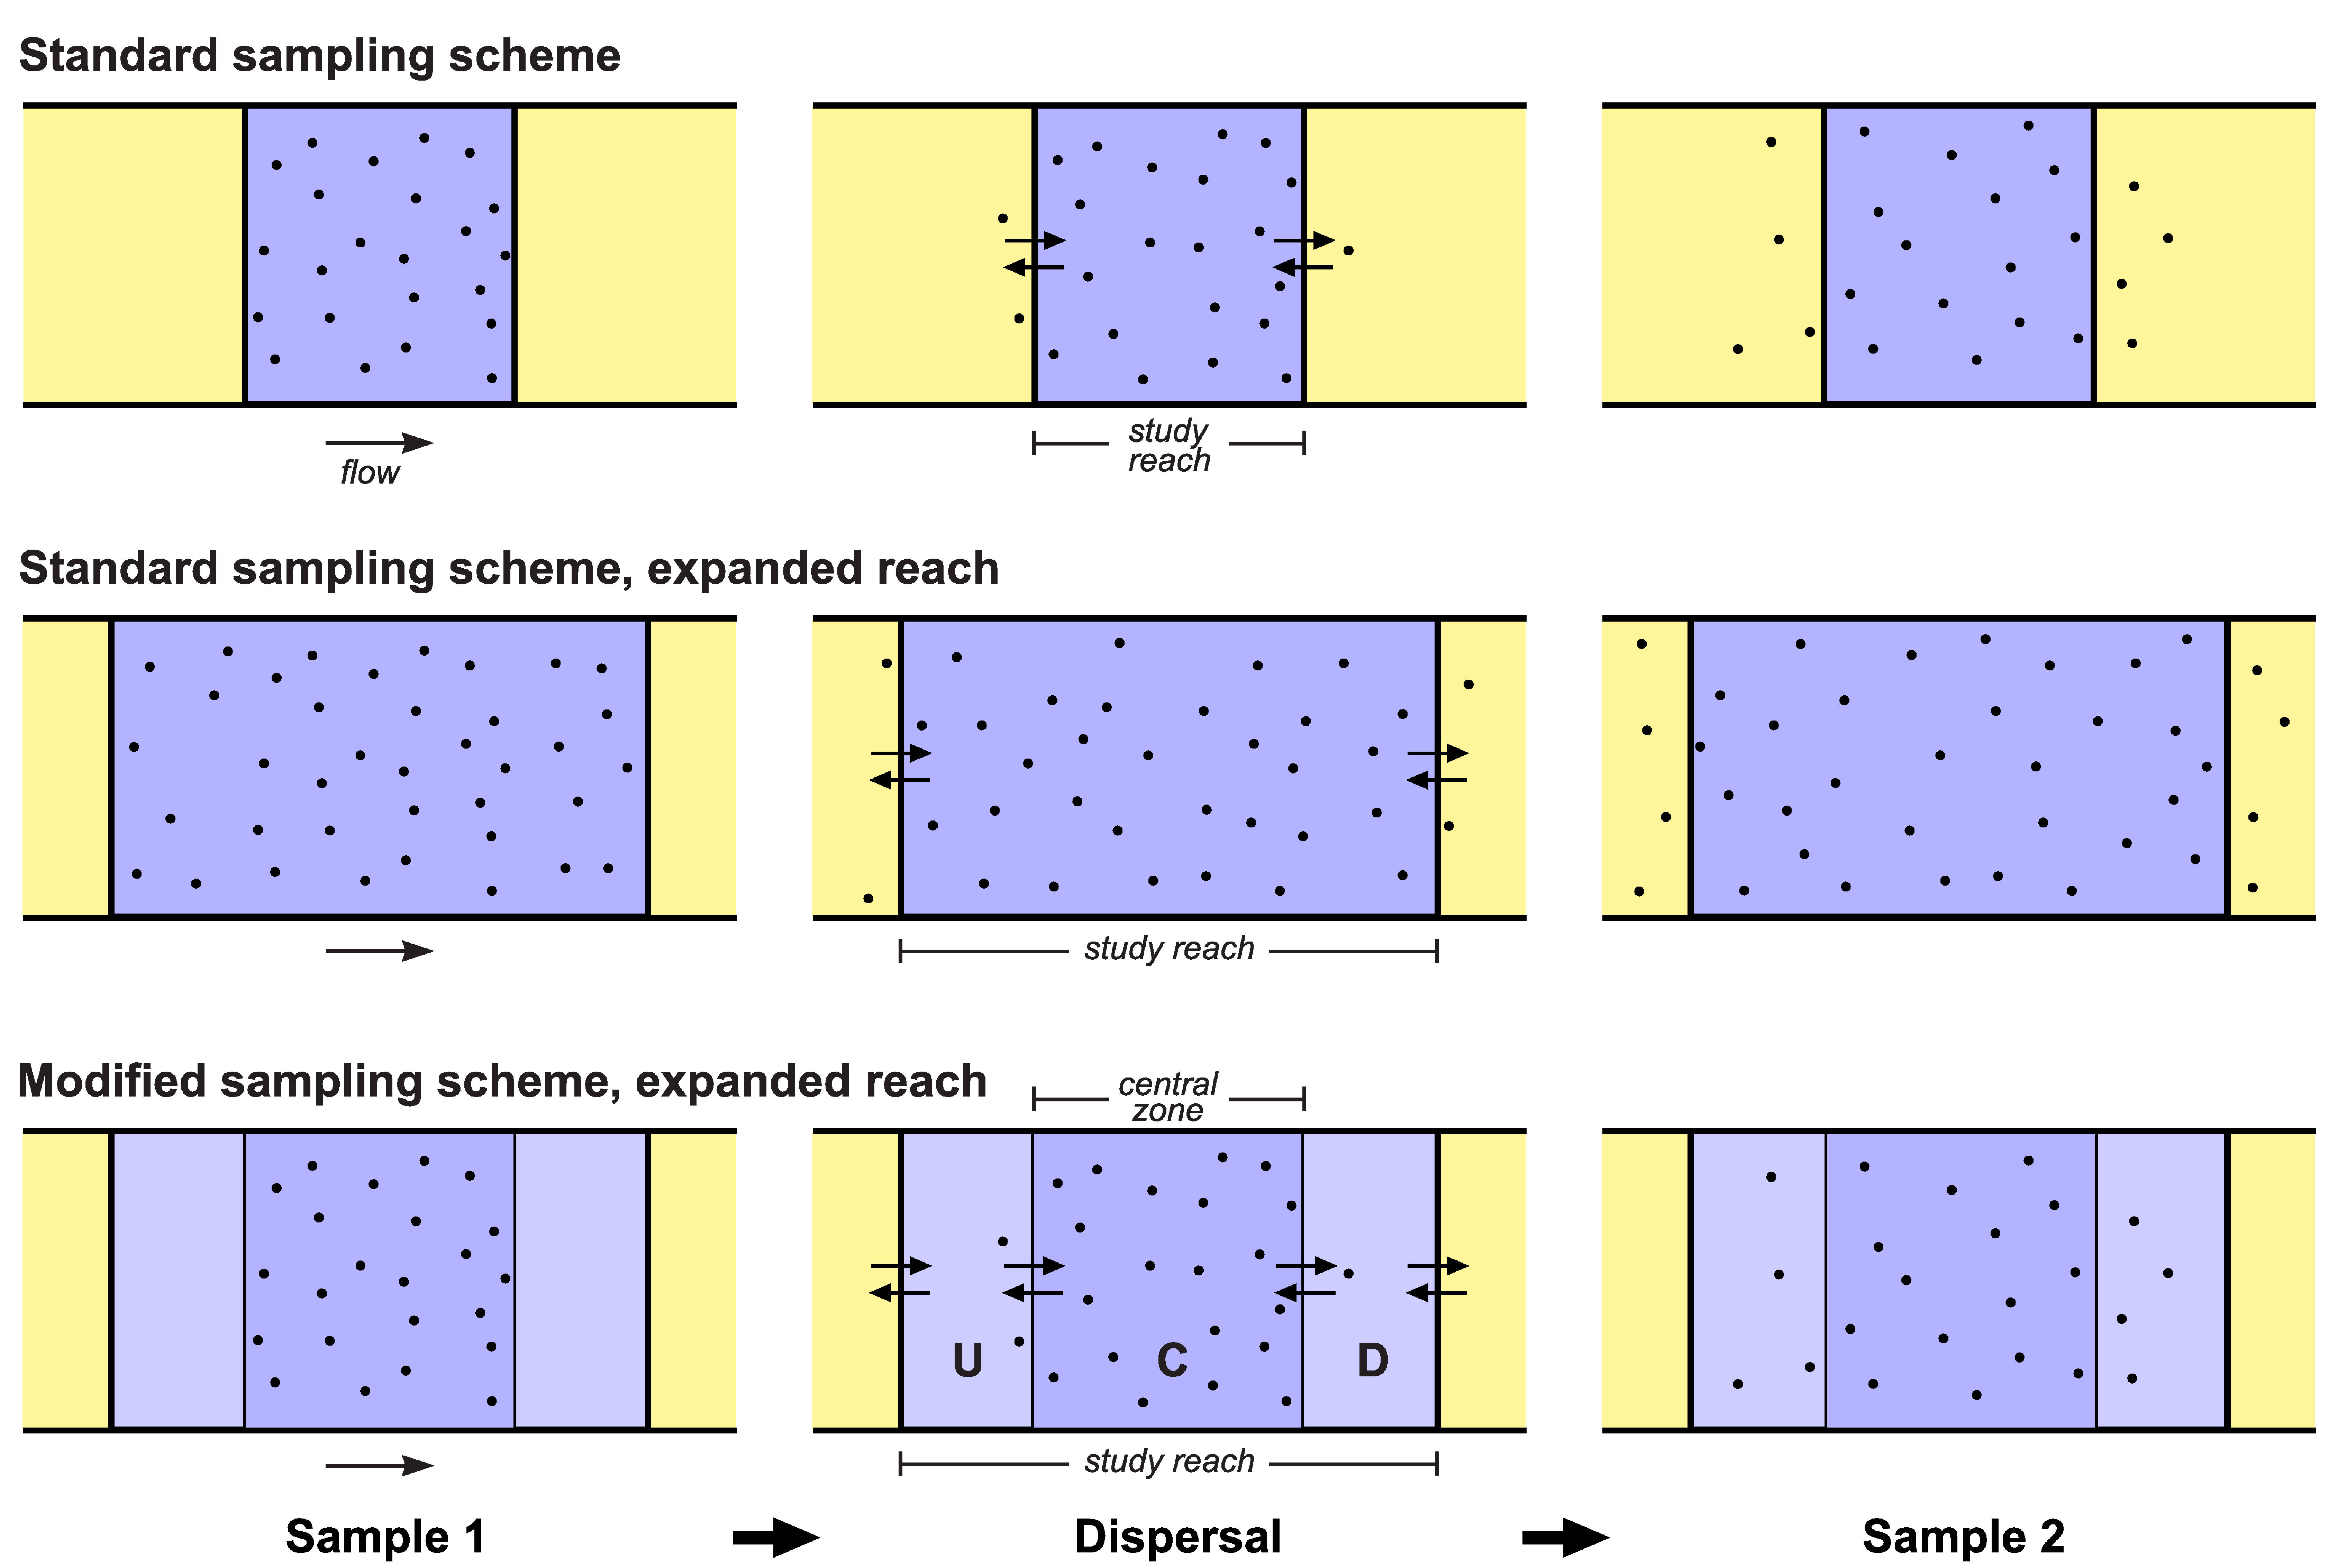
The 2-sample mark-recapture method with Chapman's estimator is often used by inland fishery managers to estimate the reach-scale abundance of stream fish. An important assumption of this method is that no dispersal into or out of the study reach occurs between the two samples. Violations of this assumption are probably common in practice, but their effect on bias (systematic error) of abundance estimates is poorly understood, especially in small populations. Estimation methods permitting dispersal exist but, for logistical reasons, are infeasible for routine assessments in streams and are therefore rarely used. The purpose of this research is to extend available results regarding effects of dispersal on the bias of Chapman's estimator as applied to reach-scale studies of stream fish abundance. We examine for the first time the joint effects of dispersal and sampling variation on the bias of this estimator. To reduce the bias effects of dispersal, we propose a modified sampling scheme in which the original study reach is expanded, a central subreach is sampled during the mark session (sample 1), and the entire reach is sampled during the recapture session (sample 2) (see Fig. 1 below). This modified sampling scheme can substantially reduce bias effects of dispersal without requiring unique marking of individual fish (hence, no tag purchases are required) or additional site visits. Our analytical and simulation results (available here) show that sampling variation tends to create negative bias with respect to study-reach abundance, while dispersal tends to create positive bias; when both factors are present, the resulting bias can be positive, negative, or zero, depending on the true abundance, capture probabilities, and amount and nature of dispersal. In most cases, simply expanding the study reach is an effective way to reduce dispersal-related bias of Chapman's estimator, but expanding the study reach and employing the modified sampling scheme we propose is a better alternative for accurately estimating abundance with the same level of sampling effort (see examples in Fig. 2 below).

Figure 1. Comparison of standard and modified sampling schemes applied to a stream reach subject to dispersal. The study reach is shown in tints of blue, parts of the population domain outside the study reach in yellow. Black dots: fish marked and released in sample 1 (unmarked fish not shown). Top row: Standard sampling scheme applied to a short study reach. Middle row: Standard sampling scheme applied to an expanded study reach. Bottom row: Modified sampling scheme applied to an expanded study reach; zone C is the original study reach, while zones U and D are new upstream and downstream subreaches. Sample 1 is taken from zone C, sample 2 from the entire study reach. Note that the modified sampling scheme reduces or eliminates exit of marked fish from the study area between samples 1 and 2.
Numerical examples
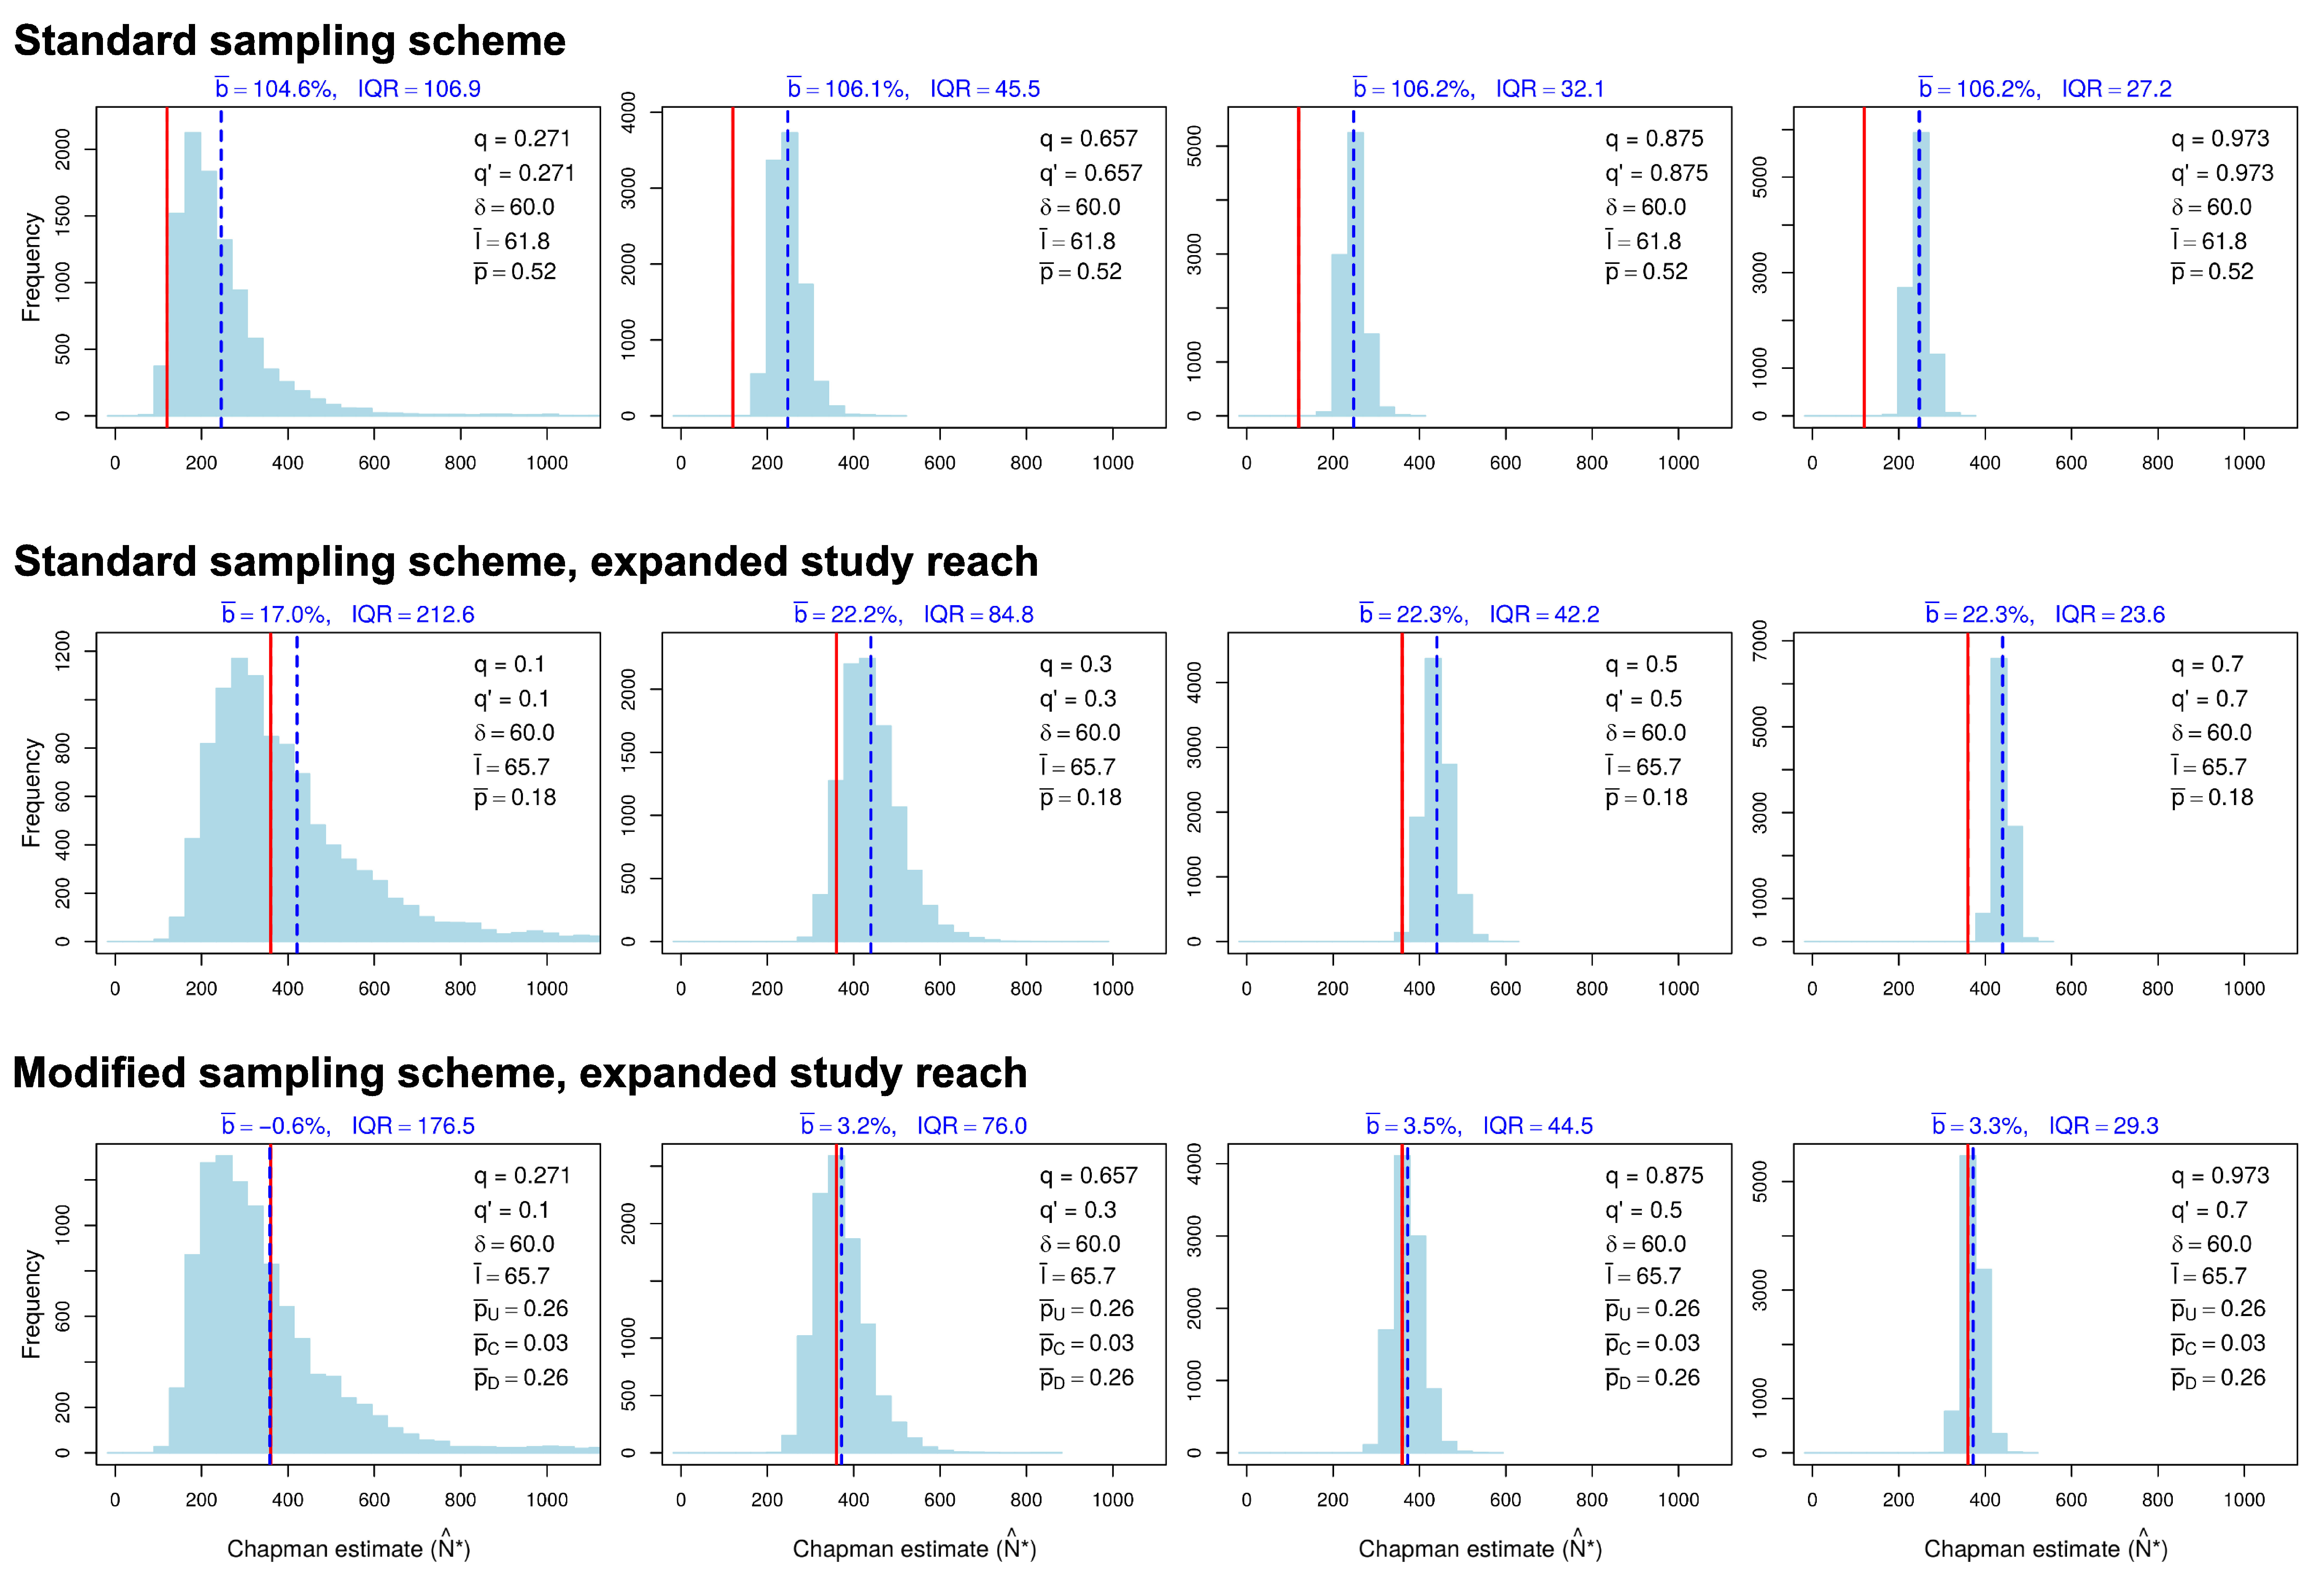
We conducted a simulation study to supplement our analytical results. A few illustrative examples are displayed in Fig. 2, which shows the empirical distribution of Chapman's estimator for three cases: (1) a study reach of length 30 (arbitrary units) with study-reach abundance n = 120, sampled with the standard sampling scheme (top row), (2) an expanded study reach of length 90 with abundance n = 360, sampled with the standard scheme (middle row), and (3) an expanded study reach of length 90 with abundance n = 360, sampled with the modified scheme (bottom row). For each case, four examples with increasing capture probabilities for samples 1 (q) and 2 (q') are shown. To ensure that the comparison of sampling cases is fair and informative, sampling effort is identical for corresponding examples in different cases, resulting in different capture probabilities between cases when the area sampled differs (e.g., standard sampling scheme in the original versus expanded study reach). Consistent with the purpose of the modified scheme, upstream zone U and downstream zone D were made long enough so few fish located in central zone C when sample 1 was taken left the study reach before sample 2 was taken. Note that the relative bias of Chapman's estimator when the standard sampling scheme was applied to the original study reach consistently exceeded 100 %. When the study reach was expanded, the relative bias dropped to roughly 20 % if the standard sampling scheme was retained but dropped to roughly 3 % if the modified sampling scheme was used.

Figure 2. Effects of expanding the study reach on the empirical distribution of Chapman's estimator with constant sampling effort. Top row: standard sampling scheme applied to a study reach of length 30 (arbitrary units) and abundance n = 120. Middle row: standard sampling scheme applied to an expanded study reach of length 90 and abundance n = 360. Bottom row: modified sampling scheme applied to an expanded study reach of length 90 and abundance n = 360, with 120 fish in each of zones U, C, and D. The four columns differ in sampling effort (duration of sampling), which increases from left to right, but sampling effort is the same in corresponding examples of the three cases. Movement distance has a symmetric beta distribution with maximum distance δ = 60 in all cases. q: sample-1 capture probability; q': sample-2 capture probability; p̅: average proportion of individuals in the study reach that exited between samples (standard sampling scheme only); p̅U, p̅C, p̅D: average proportion of individuals in zones U, C, and D of the study reach that exited the study reach between samples (modified sampling scheme only); I ̅: average number of immigrants in simulations; b̅: average relative bias with respect to n (percent) of Chapman's estimator in simulations; IQR: empirical interquartile range. Solid red lines: true study-reach abundance n; dashed blue lines: empirical mean of Chapman's estimator N̂*.
Reference
McNair, J. N., Ruetz III, C. R., Carlson, A., and Suh, J. 2018. Reducing effects of dispersal on the bias of 2-sample mark-recapture estimators of stream fish abundance. PLoS ONE 13(8): e0200733. https://doi.org/10.1371/journal.pone.0200733.
