Guide to Interpreting Dashboard
All data analyzed for this project came from the American Community Survey (ACS). The ACS is a publicly available data set made available by the US Census Bureau. The ACS replaced the long-form version administered to a sample of households as part of the US decennial census. Because our country is changing so rapidly, the ACS is conducted each year to provide more current information about the social and economic needs and changes within our communities. For more information about the ACS - please click here.
In statistics, a result is referred to as "statistically significant" if it is unlikely to have occurred by chance alone. All values were tested using a method called a two-proportion z-test to determine if the two estimates were significantly different at a 90% confidence interval. When the results were found to be statistically significant, this simply means that one can be 90% certain that the difference truly exists or that there is a less than 10% chance that the difference came entirely from random chance. For more information on statistical testing using ACS data -please click here.
How is Newaygo County Faring?
Through systematic evaluation, the results provided were designed to provide an overview of the overall direction and health of Newaygo County. These results are intended for use not solely by the Fremont Area Community Foundation, but for the larger community as a whole to encourage dialogue about the appropriate actions that can be taken to improve the well-being of all persons living in Newaygo County. With that key tenet in mind, we designed a dashboard system that provides robust results with ease of interpretation. The dashboard for each indicator displays the results for two discreet types of analyses.
Trend Analysis
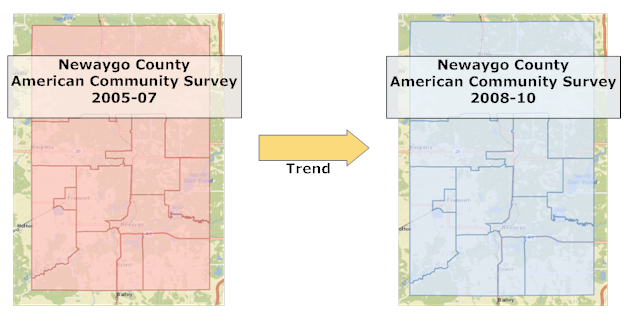
The first table in each indicator dashboard represents the overall trend of the respective indicator over the time periods between 3 Year ACS Survey for Newaygo County. For example, we compare the results of all surveys taken between the years of 2005 and 2007 (as depicted in red) and compare the results for the same survey questions or derived variables for the years of 2008 - 2010 (as depicted in blue). The advantage of this model is that it will permit relatively simple updates to the analysis as future ACS datasets are released over the years.
Trend Analysis - Comparing Newaygo County 2005-07 ACS Estimates to Newaygo County 2008-10 Estimates
Upon testing the indicator trends between the two ACS data sets, we developed a table to facilitate quick comparisons of the results. The table below provides a key for interepreting the results of the trends.
Key to Intepreting the Trends Among Newaygo County Indicators
 |
 |
 |
|---|---|---|
| Improving – Statistically significant change higher compared to 2007 and 2010 | No Change - there is no statistically significant change compared to 2007 and 2010 | Declining – Statistically significant change lower when compared to 2007 and 2010 |
Benchmark Comparisions
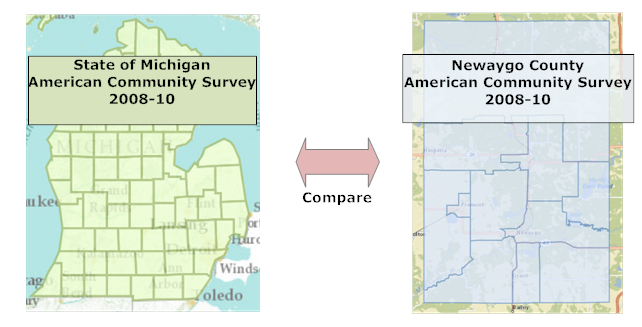
While the trend analysis detailed above can provide the direction of the indicator, it is also important to understand how Newaygo county is performing relative to the United States and the state of Michigan as a whole. The second table in each indicator dashboard represents a benchmark comparison of the respective indicator using the 2008 - 2010 3 Year ACS Survey for Newaygo County to the United States and the state of Michigan. For example, we provide benchmark comparisons from the 2008 - 2010 ACS survey for Michigan (as depicted in green) and compare the results for the same survey questions or derived variables for the years of 2008 - 2010 (as depicted in blue) from Newaygo County.
Benchmark Comparisons - Comparing Michigan 2008 - 10 ACS Estimates to Newaygo County 2008-10 Estimates
Upon testing the benchmark indicators between the two ACS data sets, we developed a table to facilitate quick comparisons of the results. The table below provides a key for interepreting the results of benchmark comparisons.
Key to Intepreting the Benchmark Comparisons Among Newaygo County Indicators
 |
 |
 |
|---|---|---|
Better – Newaygo County is performing statistically better when compared to benchmark |
No Difference - there is no statistically significant difference between Newaygo County and benchmark |
Worse – Newaygo County is performing statistically worse when compared to benchmark |