The Percentage of Households Receiving SNAP by Census Tract - 2005 to 2010 5 Year ACS Estimates
Click on any census tract in the map to get the actual value for the corresponding tract.
View Larger Map
Definition: The Supplemental Nutrition Assistance Program (SNAP) is a financial assistance program in the US that provides assistance to low income individuals and families to purchase food. Formerly known as “Food Stamps” SNAP is a federally funded aid program, but administered locally by the states. The average monthly SNAP benefit for all participating households is $276 (USDA,2010). To be eligible for SNAP, a household that is not categorically eligible and does not include an elderly or disabled member must have a monthly gross income that is at or below 130 percent of the poverty guideline ($2,297 for a family of four in the contiguous United States in 2010). Households with elderly or disabled members are not subject to the gross income standard.
Rationale: Identifying the number of individuals and families utilizing SNAP can help in pinpointing levels of need and unmet need. For example, 86% of households receiving SNAP live either at or below the poverty line (USDA,2010). By comparing the poverty levels of Newaygo County as compared to SNAP participation levels, one can begin to surmise the areas within the county where populations that could potentially benefit from SNAP benefits are likely to live and devise targeted strategies to either assist with enrollment and/or provide hunger relief services. Furthermore, utilization of SNAP benefits is often concentrated among poorer households. Among all household utilizing SNAP in the US, 42% hand incomes less than half of the US poverty guidelines (USDA, 2010). To put this into some perspective, a household of three – one adult and two children, with income at half the national poverty guideline would mean an annual income of $9,155 a year. It is therefore important to examine poverty levels and SNAP participation simultaneously to obtain a fuller understanding of community need.
Analysis: The percentage of all households utilizing the Food Stamp program increased from 2007 to 2010 (3-year estimates) which is categorized as becoming worse over time. However, this could be due to either an increased need for the program or simply, an increase in awareness about the program. The percentage of households living in poverty and those with children both decreased in terms of SNAP participation, which is categorized as an improvement over time. The percentage of total households utilizing SNAP in Newaygo County is greater than those in the US and Michigan. However, the percentage of those households with children that are also utilizing SNAP in Newaygo County is lower than those in the US and Michigan.
Click on any census tract in the map to get the actual value for the corresponding tract.
| Measure | ACS 3 Year Estimate | Trend | |
|---|---|---|---|
| 2005 to 2007 | 2008 to 2010 | ||
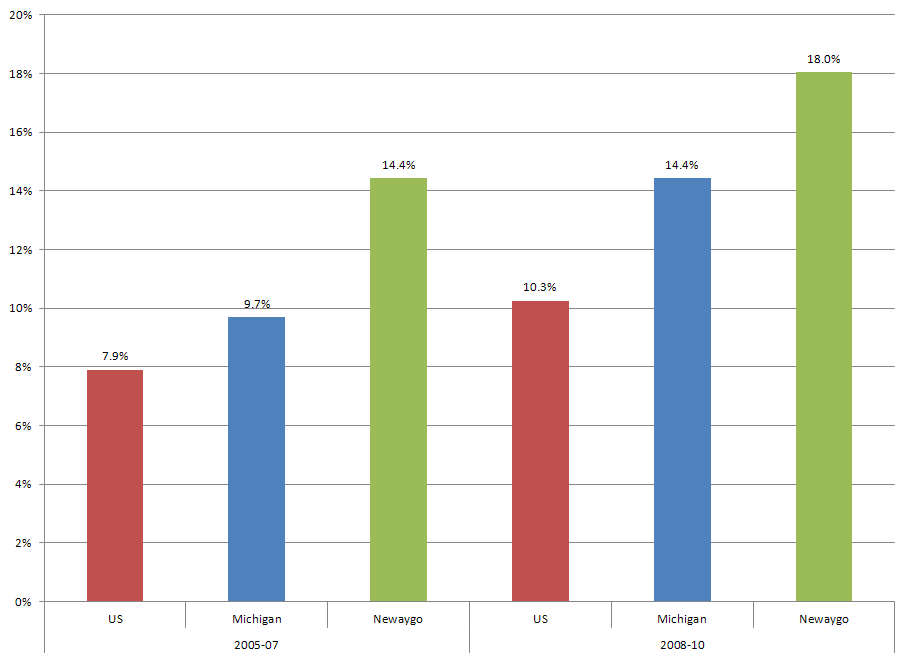
| All Households | 14.4% | 18.0% |  |
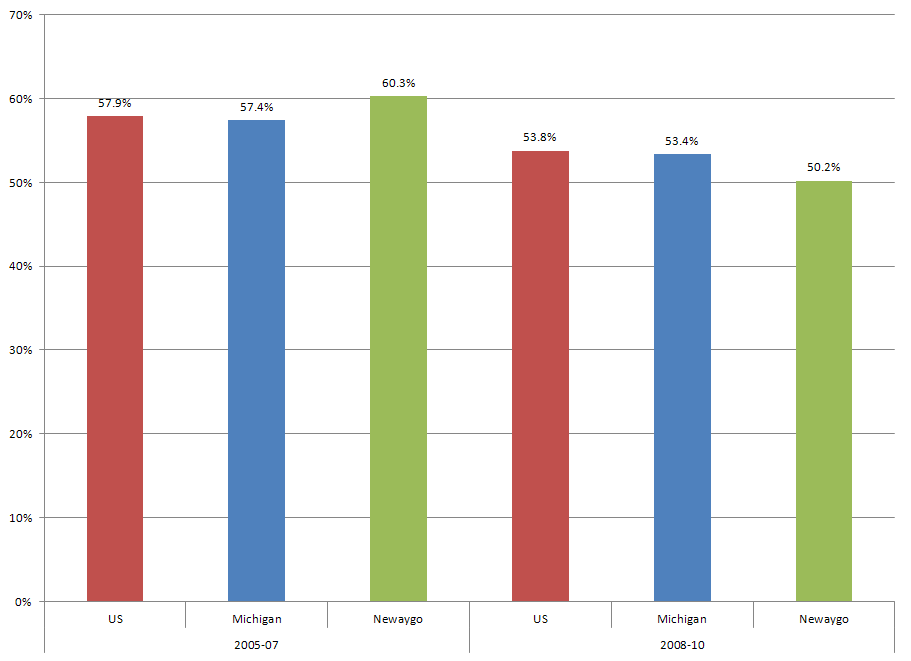
| Households Below Poverty | 60.3% | 50.2% |  |
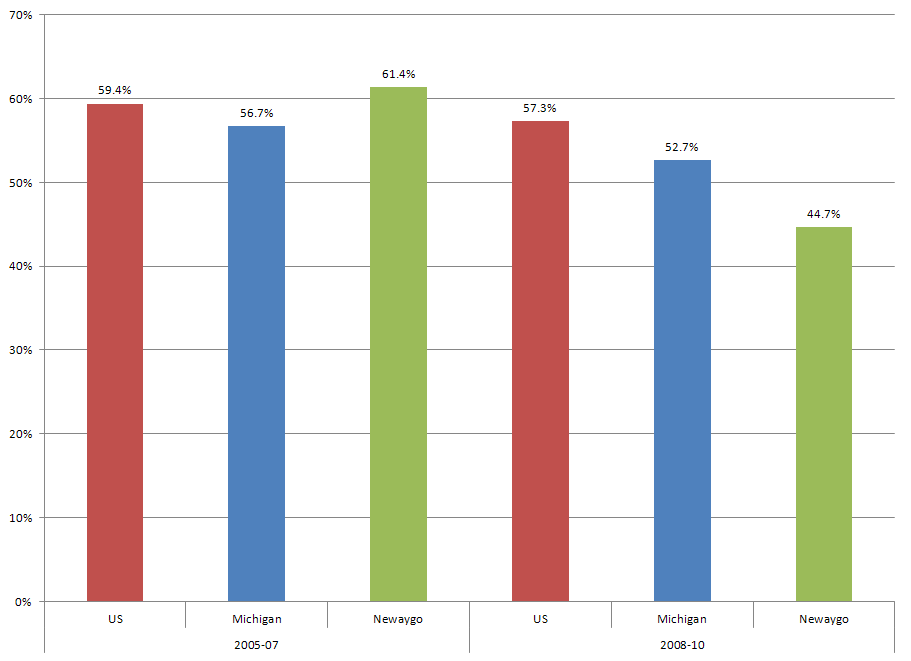
| Households with Children | 61.4% | 44.7% | |
| Comparision Groups | ACS 2008 – 2010 Estimate | Newaygo County Compared to Benchmark |
|---|---|---|
| All Households - Newaygo County | 18.0% | |
| US | 10.3% |  |
| Michigan | 14.4% | |
| Households Below Poverty | 50.2% | |
| US | 53.8% |  |
| Michigan | 52.7% | |
| Households with Children | 44.7% | |
| US | 53.7% |  |
| Michigan | 52.7% | |
For a key to interpreting the trend and benchmark analysis - please click here.
SNAP Participation – All Households: United States, Michigan and Newaygo County – 2007 & 2010 Estimates
SNAP Participation – Households Below Poverty: United States, Michigan and Newaygo County – 2007 & 2010 Estimates
SNAP Participation – Households with Children: United States, Michigan and Newaygo County – 2007 & 2010 Estimates