Unemployment Rate by Census Tract - 2005 to 2010 5 Year ACS Estimates
Click on any census tract in the map to get the actual value for the corresponding tract.
View Larger Map
JOB MARKET
Definition: Assessing the health of the job market is based on two variables: 1) Labor force participation and 2) unemployment. Labor force participation is the percentage of civilian (not in the military or in prison) working-age persons who are either:
For purposes of this analysis, we defined the working age population as those between the ages of 25 and 64. Those younger than 25 or older than 64 were excluded because they are typically students or homemakers and those above 64 are more likely to be retired. The unemployed are defined as those between the ages of 25 and 64 that were neither “at work” nor “with a job but not at work”, were actively looking for work during the last 4 weeks and were available to start a job (U.S. Census Bureau, 2010).
Rationale: The effects of the most recent economic downturn on the job market and employment have perplexed economists, forcing those examining the question to look more broadly beyond simple unemployment statistics. The Congressional Budget Office reckoned the civilian population 16 and older grew by 5.4 million over the past two years, yet the number of people working or looking for work did not grow at all (CBO, 2011). The net effect is that the official unemployment rate may be giving a misleadingly rosy reading of the job market because it includes only those actively looking for work. Therefore, the job market and full employment is likely to be worse than the current jobless rates suggest.
Economists are particularly concerned about the falling labor force participation rates because it portends larger numbers of discouraged Americans who may be turning to disability benefits, retirement or other forms of assistance. Ultimately, many who fall into this category will need government support to make ends meet thereby worsening local, state and federal budget deficits (Wessel, 2012). Therefore, by examining the job market in terms of labor force participation and unemployment it paints a more complete picture of the economic health of Newaygo County.
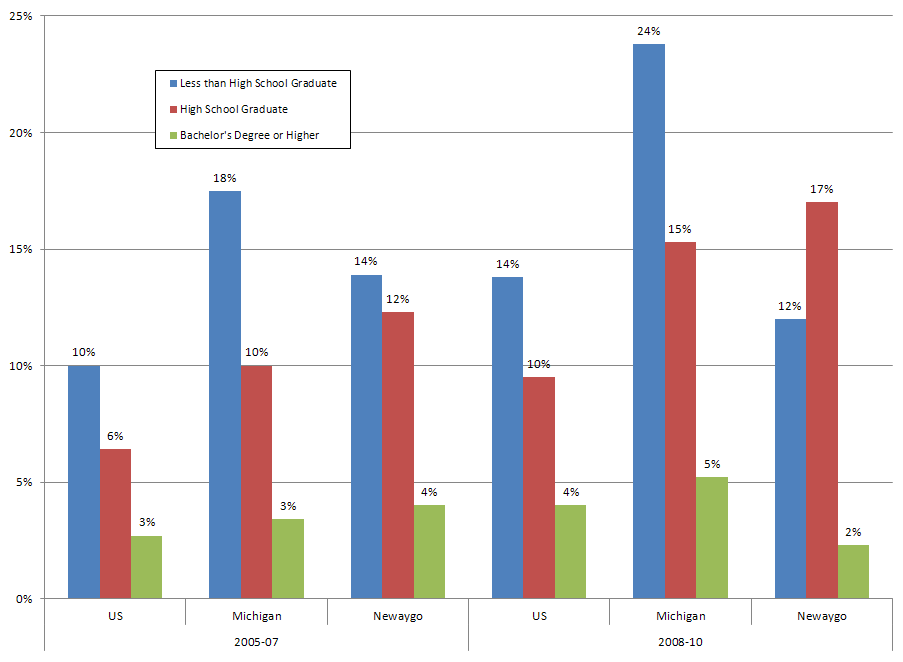
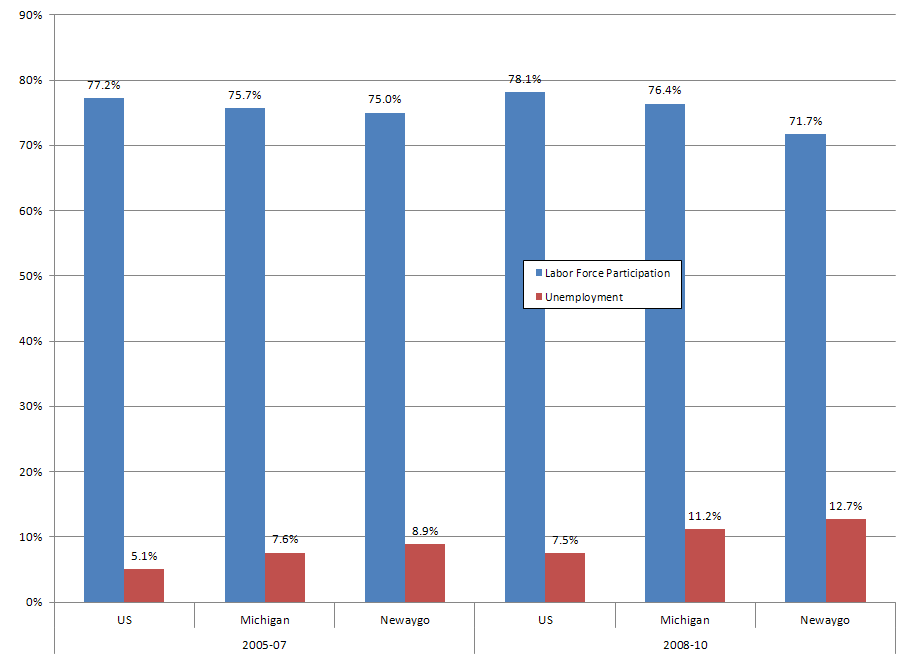
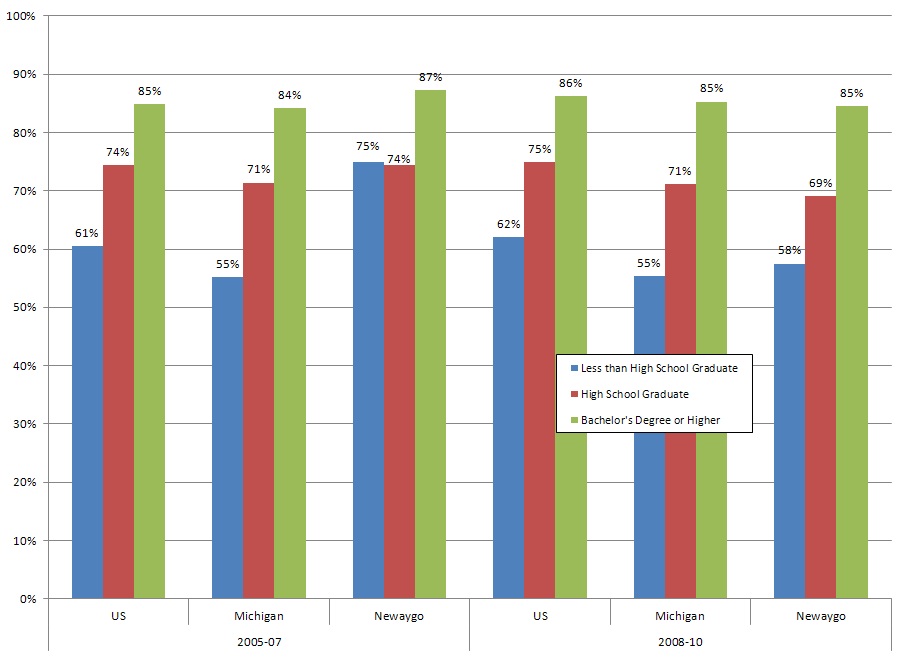
Analysis: Many of the job market indicators for Newaygo County have been trending lower over the past several years. When examining the entire labor force in Newaygo County, labor force partition fell from 75.0% in 2007 to 71.7% in 2010. Over the same time period the unemployment rate markedly deteriorated from 8.9% to 12.7%. We also examined labor force participation and unemployment rates by selected levels of educational attainment. Those with lower levels of education (less than a high school degree and those with a high school degree) fared much worse between 2007 and 2010 than those with higher levels of educational attainment (bachelor’s degree or higher).
When comparing Newaygo County to the US and Michigan the data were mixed. In 2010, the labor force participation rate in Newaygo County (71.7%) was significantly lower than either the US (78.1%) and Michigan (76.4%). The overall unemployment rate was also higher in Newaygo County (12.7%) as compared to the US (7.5%). The one bright spot in Newaygo County was among those with a bachelor’s degree or higher. While the proportion of workers with a bachelor’s degree or higher was comparable to both the US and Michigan, the unemployment rate for Newaygo County (2.3%) was significantly better than the US (4.0%) and the state of Michigan (5.2%).
For a printable version of the indicator - Please Click Here.
Click on any census tract in the map to get the actual value for the corresponding tract.
| Measure | ACS 3 Year Estimate | Trend | |
|---|---|---|---|
| 2005 to 2007 | 2008 to 2010 | ||
| Population Between 25 and 64 | |||
| In Labor Force | 75.0% | 71.7% |  |
| Unemployment | 8.9% | 12.7% | |
| Population with Less than a High School Diploma | |||
| In Labor Force | 75.0% | 57.5% | |
| Unemployment | 13.9% | 12.0% |  |
| Population with a High School Diploma | |||
| In Labor Force | 74.7% | 69.1% | |
| Unemployment | 12.3% | 17.0% | |
| Population with a Bachelor's Degree or Higher | |||
| In Labor Force | 87.3% | 84.5% | |
| Unemployment | 4.0% | 2.3% | |
| Comparision Groups | ACS 2008 – 2010 Estimate | Newaygo County Compared to Benchmark |
|---|---|---|
| Population Between 25 and 64 - In Labor Force | 71.7% | |
| US | 78.1% |  |
| Michigan | 76.4% | |
| Population Between 25 and 64 - Unemployed | 12.7% | |
| US | 7.5% | |
| Michigan | 11.2% |  |
| Less than a High School Degree - In Labor Force | 57.5% | |
| US | 62.0% | |
| Michigan | 55.4% | |
| Less than a High School Degree - Unemployed | 12.0% | |
| US | 13.8% | |
| Michigan | 23.8% |  |
| High School Degree or GED - In Labor Force | 69.1% | |
| US | 74.9% | |
| Michigan | 71.2% | |
| High School Degree or GED - Unemployed | 17.0% | |
| US | 9.5% | |
| Michigan | 15.3% | |
| Bachelor's Degree or Greater - In Labor Force | 85.4% | |
| US | 86.2% | |
| Michigan | 85.3% | |
| Bacehlor's Degree or Greater - Unemployed | 2.3% | |
| US | 4.0% | |
| Michigan | 5.2% | |
For a key to interpreting the trend and benchmark analysis - please click here.
Job Market Measures of the Population of Working Age (25 to 64): United States, Michigan, and Newaygo County – 2007 & 2010 Estimates
Labor Force Participation Rates of the Population of Working Age (25 to 64) by Educational Attainment: United States, Michigan, and Newaygo County – 2007 & 2010 Estimates
Unemployment Rates of the Population of Working Age (25 to 64) by Educational Attainment: United States, Michigan, and Newaygo County – 2007 & 2010 Estimates