Child Poverty (0 to 18) by Census Tract - 2005 to 2010 5 Year ACS Estimates
Click on any census tract in the map to get the actual value for the corresponding tract.
View Larger Map
Definition: Census Bureau uses a set of money income thresholds that vary by family size and composition to determine who is in poverty. If a family's total income is less than the family's threshold, then that family and every individual in it is considered in poverty. The official poverty thresholds do not vary geographically, but they are updated for inflation using Consumer Price Index (CPI-U). The official poverty definition uses money income before taxes and does not include capital gains or noncash benefits (such as public housing, Medicaid, and food stamps). In 2010, the latest year in which data are available, the U.S. Department of Health and Human Service’s threshold for a family of four (i.e. two parents with two children) was $22,050.
Rationale: Poverty is linked to a number of negative educational, health-related, and emotional outcomes across all age groups. The effects of poverty are especially punishing on children as the impacts can begin before birth and continue well into adulthood. Children living in poverty are more likely than children from non-poverty families to develop disease and to experience more severe effects from any disease they may develop.
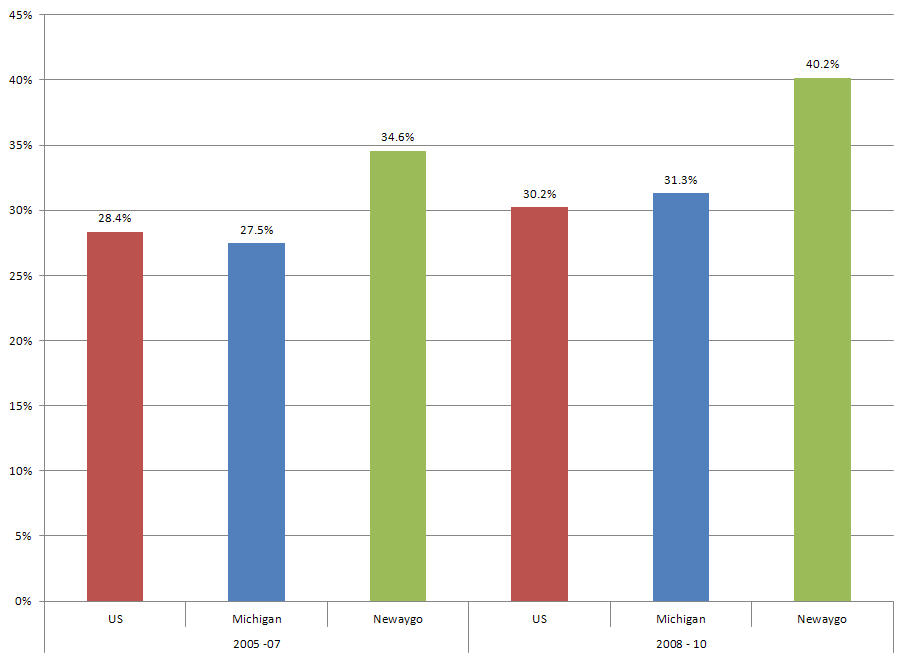
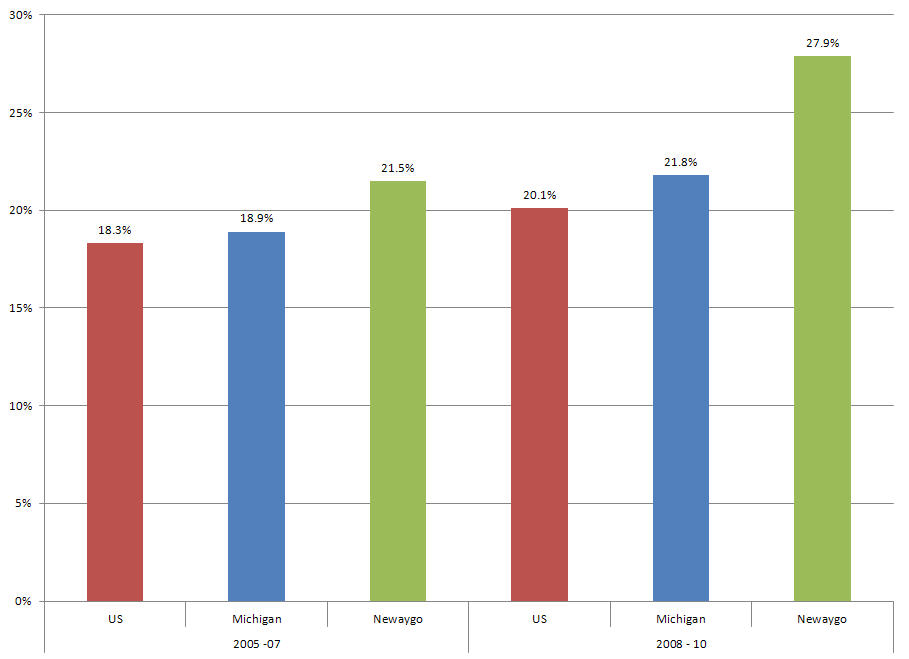
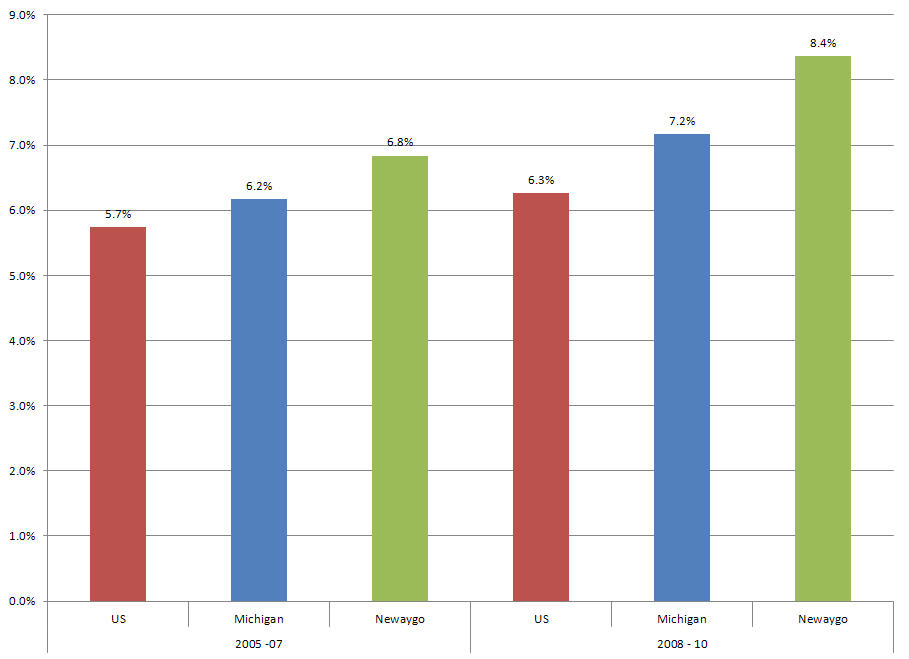
Analysis: The proportion of children living in poverty in Newaygo County rose dramatically between 2007 and 2010, climbing more than six percent from 21.5% to 27.9%. The proportion of children living in poverty within Newaygo County was also significantly higher in 2010 when compared to the US (20.1%) and the state of Michigan (21.8%). Among those living in extreme poverty – those surviving at 50% of the federal poverty level (FPL), the trend between 2007 and 2010 was unchanged in Newaygo County. Individuals living in extremely poverty were significantly higher in Newaygo County (8.4%) than the US (6.3%) in 2010. This rate, however, was not different than the overall rate for the state of Michigan. The third and final poverty metric examines all individuals living at or below 185% of FPL. Quantifying the proportion of individuals living at or below 185% FPL is important because this is the maximum eligibility criterion for many public assistance programs, such as SNAP, Head Start, free and reduced lunch at school, Medicaid and MI Child. Between the 2007 and 2010, the proportion of the population living at or below 185% FPL significantly increased from 34.6% to 40.2%. This would seem to indicate that as many as 4 in 10 residents in Newaygo County could conceivably be eligible for SNAP benefits. The sharp increase between 2007 and 2010 also resulted in Newaygo County having significantly higher proportions of poor and near poor when compared to the US (30.2%) and the state of Michigan (31.3%).
For a printable version of the indicator - Please Click Here.
Click on any census tract in the map to get the actual value for the corresponding tract.
| Measure | ACS 3 Year Estimate | Trend | |
|---|---|---|---|
| 2005 to 2007 | 2008 to 2010 | ||
| Child Poverty (0 to 18) | 21.5% | 27.9% |  |
| Individuals Living at 50% of FPL or Below | 6.8% | 13.3% |  |
| Individuals Living at 185% of FPL or Below | 34.6% | 40.2% | |
| Comparision Groups | ACS 2008 – 2010 Estimate | Newaygo County Compared to Benchmark |
|---|---|---|
| Child Poverty (0 to 18) - Newaygo County | 27.9% | |
| US | 20.1% |  |
| Michigan | 21.8% | |
| Individuals Living at 50% of FPL or Below - Newaygo County | 8.4% | |
| US | 6.3% | |
| Michigan | 7.2% |  |
| Individuals Living at 185% of FPL or Below - Newaygo County | 40.2% | |
| US | 30.2% | |
| Michigan | 31.3% | |
For a key to interpreting the trend and benchmark analysis - please click here.
Child Poverty (18 and Under): United States, Michigan, and Newaygo County – 2007 & 2010 Estimates
Extreme Poverty – 50% of FPL: United States, Michigan, and Newaygo County – 2007 & 2010 Estimates
Poor and Near Poor – 185% of FPL: United States, Michigan, and Newaygo County – 2007 & 2010 Estimates