Population Ages 25 to 64 with a Bachelor's Degree or Higher By Census Tract - 2005 to 2010 ACS 5 Year Estimates
Click on any census tract in the map to get the actual value for the corresponding tract.
View Larger Map
Definition: The highest level of education attained by adults of working age – between the ages of 25 to 64. The results are provided in two categories: 1) the proportion of the adults with a high school degree or greater. Adults that have completed a general equivalency diploma (GED) are included in these figures and 2) the proportion of adults with a bachelor’s degree or greater.
Rationale: The benefits of having an educated population are numerous. Among the most obvious is the relationship between education and income. Among adults between 25 and 64 that worked during the past year, average earnings ranged from $18,900 for high school dropouts to $25,900 for high school graduates, $45,400 for college graduates, and $99,300 for workers with professional degrees (Day & Newburger, 2002) Globalization and technology have been and most likely will be the forces that continue to transform the economy well into the future. These knowledge-based economies do and will continue to require high levels of education and skill.
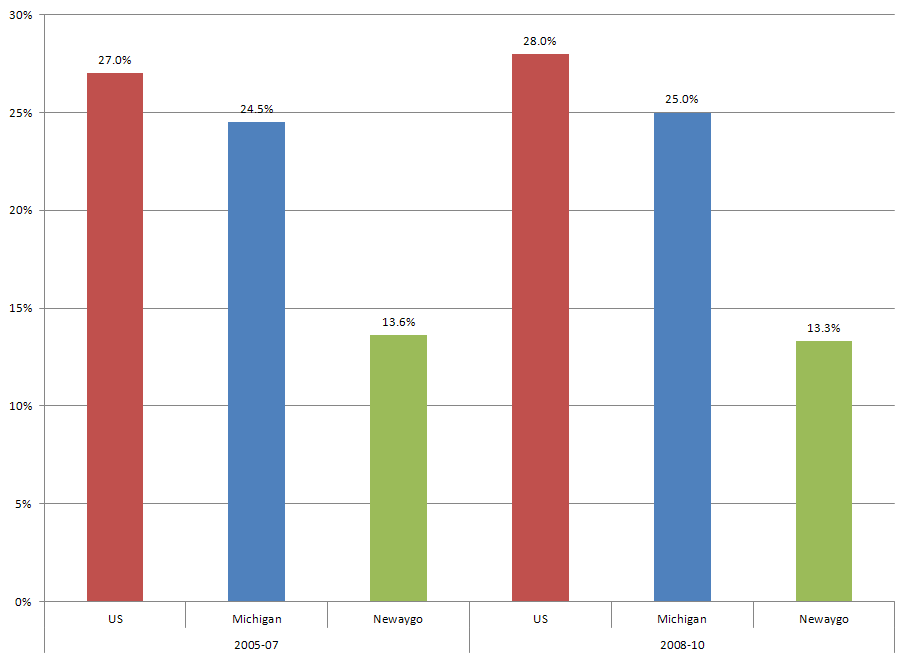
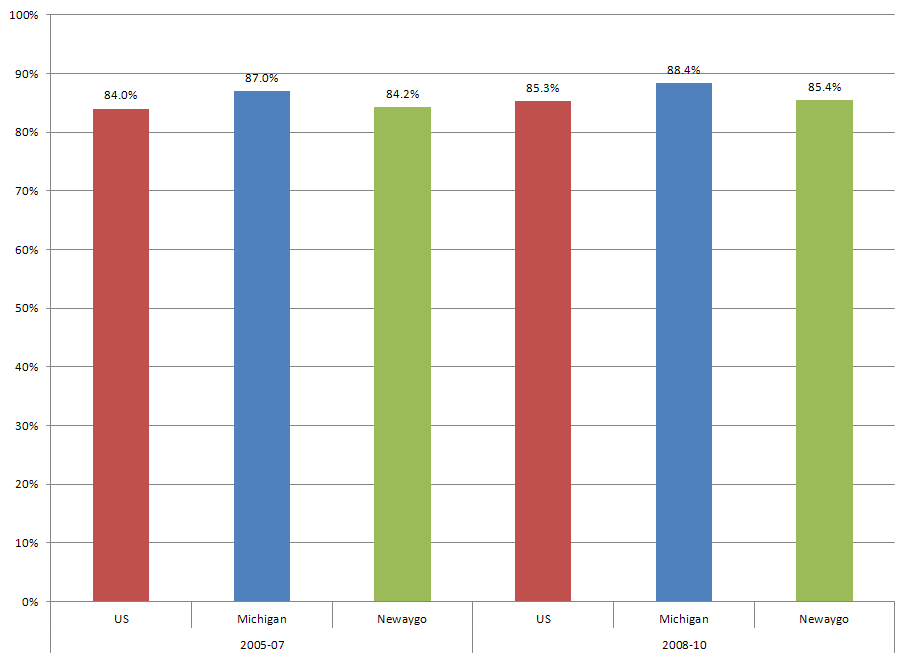
Analysis: The proportion of the population of working age with a high school degree or more education was unchanged (approximately 85%) between 2007 and 2010 in Newaygo County. Likewise, the proportion of the population with a bachelor’s degree or more education was also unchanged (approximately 13%) over this same time period. When comparing the educational attainment of the population in Newaygo County to that of the United States and the state of Michigan, Newaygo County trails these benchmarks. Although there were no differences between the US and Newaygo County in the proportion of the population with a high school degree or more in 2010, Newaygo County is significantly lower than the state of Michigan in this key metric (85.4% versus 88.4%). Among those with a bachelor’s degree or more, Newaygo County fares much worse. The proportion of the population in Newaygo County with a bachelor’s degree or more (13.3%) is significantly lower than that of the US (28.0%) and the state of Michigan (25.0%).
For a printable version of the indicator - Please Click Here.
Click on any census tract in the map to get the actual value for the corresponding tract.
| Measure | ACS 3 Year Estimate | Trend | |
|---|---|---|---|
| 2005 to 2007 | 2008 to 2010 | ||
| High School Diploma or Greater (includes GED) | 84.2% | 85.4% |  |
| Bachelor's Degree or Greater | 13.6% | 13.3% | |
| Comparision Groups | ACS 2008 – 2010 Estimate | Newaygo County Compared to Benchmark |
|---|---|---|
| High School Diploma or Greater (includes GED) - Newaygo | 85.4% | |
| US | 85.3% |  |
| Michigan | 88.4% |  |
| Bachelor's Degree or Greater - Newaygo County | 13.3% | |
| US | 28.0% | |
| Michigan | 25.0% | |
For a key to interpreting the trend and benchmark analysis - please click here.
High School Diploma or Higher: United States, Michigan, and Newaygo County – 2007 & 2010 Estimates
Bachelor’s Degree or Higher: United States, Michigan, and Newaygo County – 2007 & 2010 Estimates